
The 5 Primary Reports in Your Dashboard
By the end of this guide, your Event ROI dashboard will contain the following five reports:
1. Leads Generated (Broken Down by Event Source)
- Track which conferences or events drive the most leads
-
Understand which events generate the most awareness for your brand
2. Leads Generated (Broken Down by Team Member)
-
Track which employees capture the most leads
-
Identify top (and bottom) performers on your team
3. Opportunities/Deals Created (Broken Down by Event Source)
-
Track how many opportunities/deals were created from events
-
Understand the quality of leads generated from each event
4. Pipeline Revenue Generated (Broken Down by Event Source)
-
Track how much potential new revenue was created from each event
-
Understand how much revenue opportunity events bring to your business
5. Actual Closed-Won Revenue Generated (Broken Down by Event Source)
-
Attribute the closed-won revenue back to each event
-
Compare events by ROI to understand which events have the biggest impact
Integrate HubSpot to Popl
Popl’s native HubSpot integration is fully self-serve and fully customizable.
Setting up field mappings in Popl's intuitive configuration manager allows you to define exactly which Popl fields sync to your HubSpot properties, giving you complete visibility and control over how your data flows from Popl into HubSpot.
This ensures your lead data stays clean, consistent, and aligned with your CRM structure.
If you haven't already integrated your HubSpot account with Popl, you'll need to do that now (instructions here). It only takes a couple of minutes.
Once you've connected the two platforms, you're ready to start configuring your mappings.
Set Your HubSpot Reporting Permissions
To set up your Event ROI Dashboard in HubSpot, you’ll need the following permissions:
1. Dashboards, Reports, and Analytics
“View” and “Edit” access for advanced dashboard features (i.e., data records, share, and creation of dashboards)
2. Reporting Datasets
“View” access to group your HubSpot data in collections for quick and easy reporting
3. Marketing Reports
Access to marketing reports, including traffic analytics, page performance, competitors, tracking URL builder, events, and report settings
Create HubSpot Properties and Map Fields to Popl
HubSpot’s default properties are a solid starting point for attribution reporting. However, to fully leverage the rich context captured by Popl, we recommend creating some custom properties in HubSpot.
These custom properties serve as the building blocks for your attribution reporting, enabling intuitive filtering and making it easy to build your Event ROI dashboard.
While Popl allows for unlimited custom mappings into HubSpot, there are 17 properties that we strongly suggest you map into HubSpot. Of these 17 properties, 7 are default HubSpot properties. The other 10 are custom properties that we recommend you create.
7 Default HubSpot Properties to Map

👉 Click here to download a CSV version of this spreadsheet.
1. First Name
- The first name of the lead
2. Last Name
- The last name of the lead
3. Email
- The email address of the lead
4. Job Title
- The job title/role of the lead
5. Company Name
- The company name of the lead
6. Phone Number
- The phone number of the lead
7. Contact Owner
- The HubSpot property named "Contact Owner" represents a “user select” type property and therefore can only select from people who have a user seat in your HubSpot account. If the Popl user who captured the lead is not a user in HubSpot, then the "Contact Owner" property in HubSpot will be automatically assigned to the Popl admin who set up the HubSpot integration.
10 Custom HubSpot Properties to Map

👉 Click here to download a CSV version of this spreadsheet.
1. Original Popl Event Name
-
This is the name of the first event where the lead was captured initially with Popl
-
This Event Name typically corresponds 1:1 with the name of the campaign in Popl
2. Latest Popl Event Name
-
The most recent event at which a lead was captured with Popl
-
It’s not uncommon for the same lead to be scanned at multiple events. The “Latest Popl Event Name” property ensures the “Original Popl Event Name” property isn’t overwritten and updates the record of the most recent event.
3. Original Popl Lead Owner
-
This is the name of the person on your team who first captured the lead with Popl
4. Latest Popl Lead Owner
-
A lead can be scanned, or “captured,” by multiple members of your team. And it can happen at different events. Having a property for “Latest Popl Lead Owner” allows us to preserve the “Original Popl Lead Owner” property while updating the record to reflect the most recent person who interacted with the lead.
5. Datestamp Original Popl Lead Captured
-
This is the original date for which a lead was captured using Popl.
6. Datestamp Latest Popl Lead Captured
-
This is the most recent date for which a lead was captured using Popl. This allows us to keep the “Original Popl Lead Captured” property date from being overwritten while updating the date record of the most recent Popl interaction.
7. Original GTM Motion
-
The GTM (go-to-market) motion that created this lead
-
There are only two options for this property (Inbound and Outbound)
-
Any leads captured with Popl at events should be considered Outbound
8. Latest GTM Motion
-
The most recent GTM motion that triggered a conversion event
-
A lead may already exist in your CRM before a team member scans their badge at an event. You don’t want to overwrite the “Original GTM Motion” property. Instead, you will update the “Latest GTM Motion” property
9. Original Lead Source
-
The first channel that created the lead (e.g. Events, Billboards, Paid Search, Organic Search, AI Search)
-
The source of any leads captured with Popl should be Events
10. Latest Lead Source
-
The most recent conversion channel that the lead interacted with
-
Again, you don’t want to overwrite the “Original Lead Source” property. Instead, you’ll update the “Latest Lead Source” property
Quick Note: Original vs Latest Properties (First-Touch vs Last-Touch Attribution)
As a best practice for attribution, you should track both first-touch and last-touch interactions. This is commonly referred to as “multi-touch attribution.” It gives you a complete view of your lead’s journey, from how they discovered you to what activity ultimately drove them to take action.
Important: Multi-touch attribution is a more advanced tactic. If you are not already familiar with first-touch vs last-touch attribution, or if you do not currently have a multi-touch attribution system in place, you should still create all of our suggested custom properties in HubSpot. They will come in handy later on. But for now, we will not actually use these properties when setting up your first Event ROI dashboard. We want to keep this process simple for you, and we can revisit multi-touch attribution reporting later once you’re ready.
That being said, let’s quickly explain the difference between first-touch and last-touch activities.
First-Touch Attribution
First-touch reveals the very first interaction that a lead had with your brand:
-
Reveals how a lead first became aware of your company
-
Useful for understanding what’s driving initial awareness
-
Limitation: ignores the rest of the journey
Last-Touch Attribution
Last-touch gives visibility into the last interaction a lead had with your brand before converting into a qualified sales opportunity (HubSpot refers to these opportunities as Deals):
-
Highlights the moment that triggered conversion (like booking a demo or creating a deal)
-
Useful for understanding what activity actually converts customers
-
Limitation: ignores the first-touch and any following touchpoints leading up to the last-touch interaction
Capturing both first-touch and last-touch data provides a more complete picture of your lead’s journey, enabling you to build a reporting dashboard that reveals how every touchpoint influences business outcomes, such as new deals and closed-won revenue. Ultimately, this gives you the power to prove event success and ROI with confidence.
Syncing Your Leads from Popl to HubSpot
Once you’ve created your new HubSpot properties and mapped them to lead fields in Popl, you’re ready to sync leads from Popl into HubSpot.
Warning: If you sync your leads to HubSpot before configuring field mappings, your new contacts will be missing the attribution data needed to report on them in HubSpot.
We recommend enabling auto-sync on the integrations settings page of your Popl dashboard, so that all new leads captured by your team are instantly pushed into HubSpot.
Once your Popl leads show up in HubSpot, you’re ready to start analyzing ROI and event performance in your new HubSpot Event ROI dashboard.

Build Your Event ROI Dashboard and Add Reports
If you’re just starting with event attribution in HubSpot, we recommend creating 5 custom reports in your new Event ROI Dashboard. For more advanced multi-touch attribution reporting, we suggest creating a few additional reports. We will discuss those later in this guide.
Important: When it comes to reporting opportunities (aka deals), pipeline, and closed-won revenue, this guide assumes you are using Deal objects in HubSpot to track sales activity and opportunities. In many cases, a company’s marketing team uses HubSpot, but the sales team uses another platform (like Salesforce) for their CRM to track sales activity. It is possible to sync Deals and sales activity from your sales team’s CRM into HubSpot, but that is beyond the scope of this guide. If you do not use Deal objects in HubSpot, then you can skip creating any reports that use Deal-related properties.
How to Create Your Event ROI Dashboard in HubSpot
Navigate to the “Reporting” tab in your HubSpot account:
-
Left-hand sidebar menu → Reporting → Dashboards → Create Dashboard
-
Name the dashboard “Event ROI Dashboard”
-
Once you’ve created the dashboard, you’re ready to start adding reports inside it. Listed below are the 5 key reports you’ll need to create.
-
To create a new report inside your Event ROI Dashboard:
-
From your Event ROI Dashboard > Top right corner > Add content > Create report > Select Custom report > Choose Contacts as the Primary Data Source
-
5 Primary Reports for Your Event ROI Dashboard
Each of the 5 reports below is listed in a way that will make it easy for you to understand which properties to apply to both the “Configure” tab and the “Filters” tab of each report. By default, we recommend using the “Vertical bar” chart type for all your reports. You can always change the chart type later to fit your personal preferences.


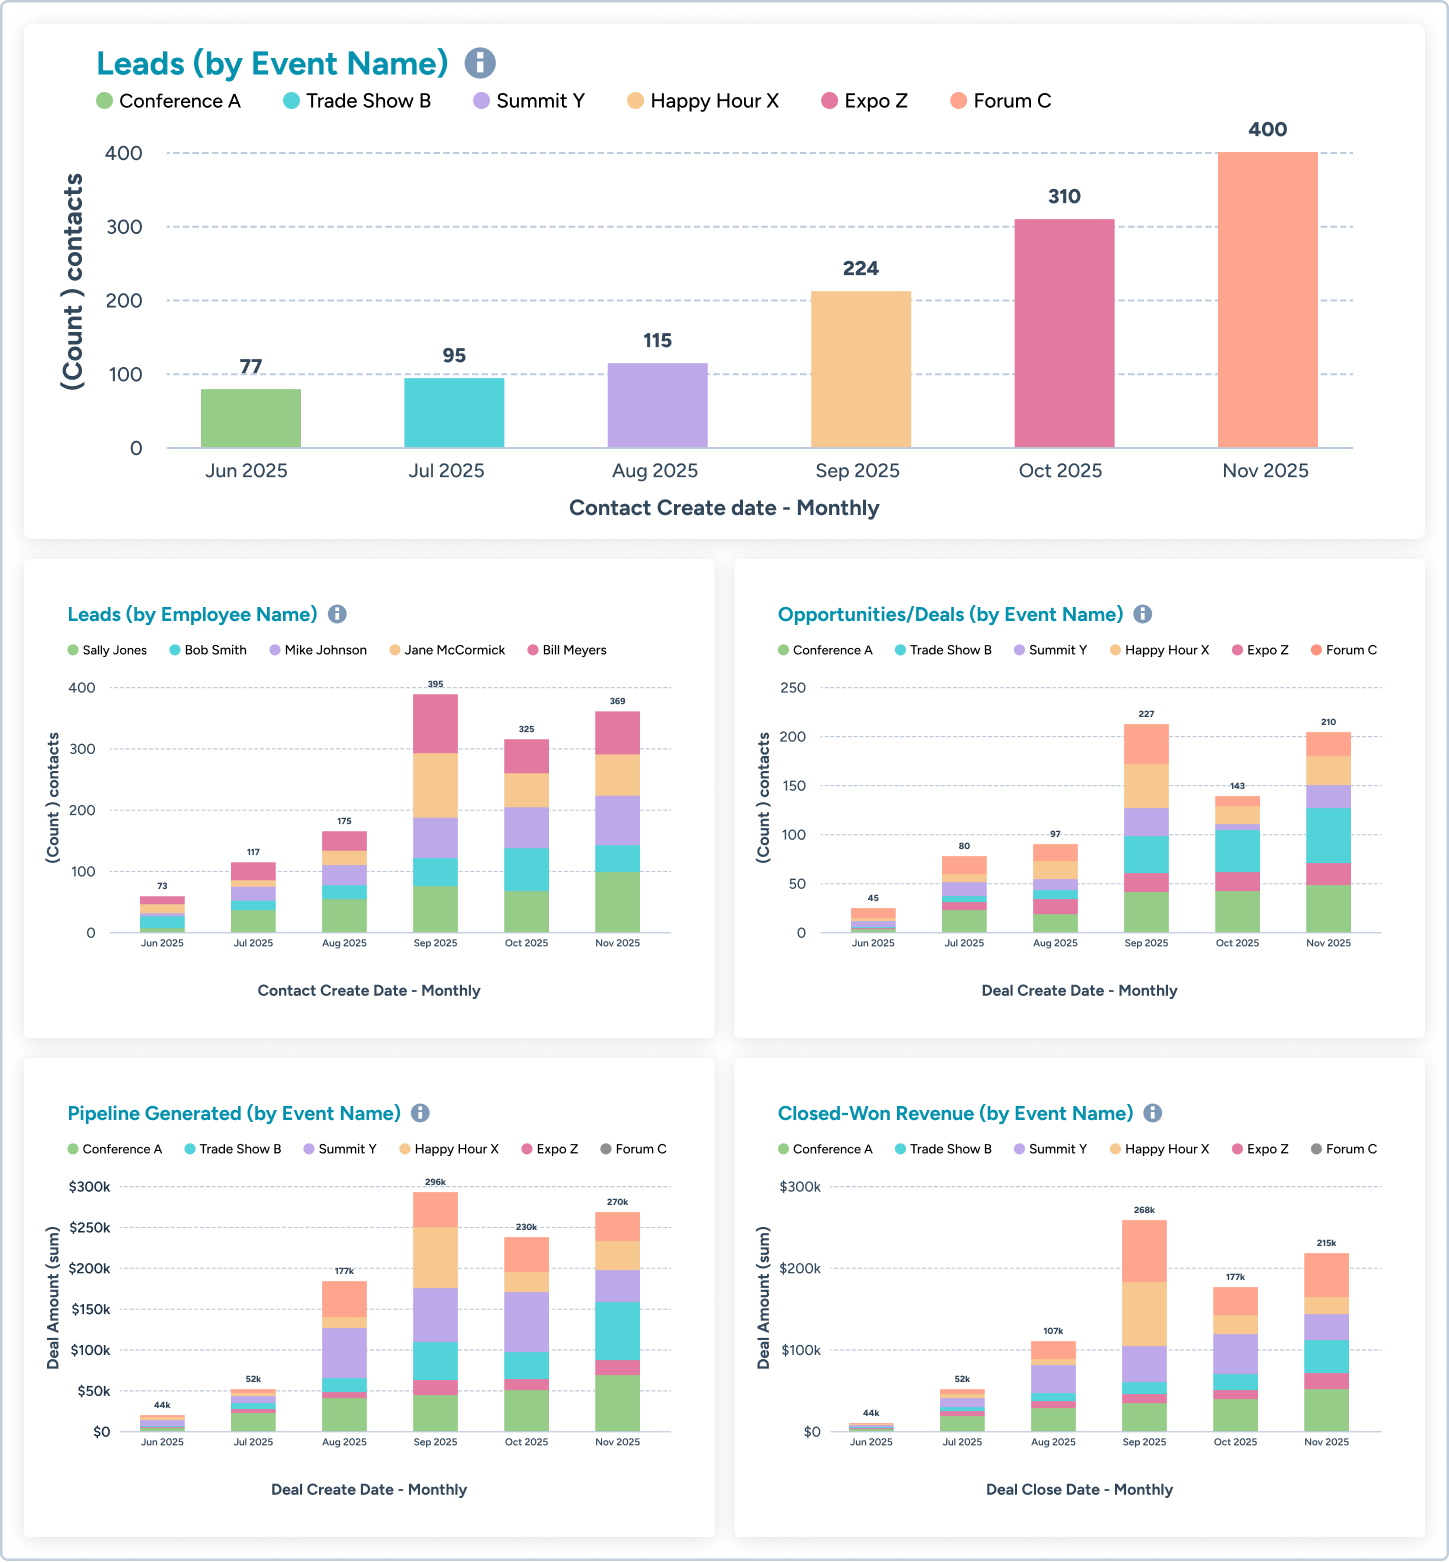
Report #1: Leads Generated (Broken Down by Event Source)
Configure Tab:
-
Chart type: Vertical bar
-
X-axis: Datestamp “Original Popl Lead Captured”
-
Set the Frequency of the axis to Monthly
-
Y-axis: (Count) contacts
-
Break down by: “Original Popl Event Name”
Filter Tab:
-
List
-
“Original Popl Event Name” is known

Report #2: Leads Generated (Broken Down by Team Member)
Configure Tab:
-
Chart type: Vertical bar
-
X-axis: Datestamp “Original Popl Lead Captured “
-
Set the Frequency of the axis to Monthly
-
Y-axis: (Count) contacts
-
Break down by: “Original Popl Lead Owner”
Filter Tab:
-
“Original Popl Event Name” is known

Report #3: Opportunities/Deals Created (Broken Down by Event Source)
Configure Tab:
-
Chart type: Vertical bar
-
X-axis: Recent deal creation date
-
Set the Frequency of the axis to Monthly
-
Y-axis: (Count) contacts
-
Break down by: “Original Popl Event Name”
Filter Tab:
-
“Original Popl Event Name” is known
-
Number of associated deals is greater than or equal to 1

Report #4: Pipeline Revenue Generated (Broken Down by Event Source)
Configure Tab:
-
Chart type: Vertical bar
-
X-axis: Recent deal creation date
-
Set the Frequency of the axis to Monthly
-
Y-axis: Recent deal amount
-
Break down by: “Original Popl Event Name”
Filter Tab:
-
“Original Popl Event Name” is known
-
Number of associated deals is greater than or equal to 1

Report #5: Actual Closed-Won Revenue Generated (Broken Down by Event Source)
Configure Tab:
-
Chart type: Vertical bar
-
X-axis: recent deal close date
-
Set the Frequency of the axis to Monthly
-
Y-axis: Recent deal amount
-
Break down by: “Original Popl Event Name”
Filter Tab:
-
“Original Popl Event Name” is known
-
Number of associated deals is greater than or equal to 1
-
The recent deal close date is known

Pro Tips for Dashboard Management
-
Once you make your first report, you can simply use HubSpot’s “clone” functionality to duplicate and modify the remaining 7 reports.
-
Don’t worry about choosing the right frequency on your X-axis (weekly, monthly, quarterly), because you can use the “Advanced filters” dropdown at the dashboard level to adjust the frequency of every report within your dashboard.

Advanced Multi-Touch Reporting in Your Dashboard
As mentioned above, multi-touch attribution is a more advanced tactic.
Capturing both first-touch and last-touch data is a best practice to implement across all of your marketing channels (not just in-person events). Multi-touch attribution provides a more complete picture of your lead’s journey and helps you understand the weight each touchpoint carries in converting your leads into customers.
For example, a lead you meet at a conference may already be familiar with your brand. They may have seen some digital ads online, watched your YouTube video, or even read a blog article on your website. Each of these interactions is a touchpoint that should ideally be captured and logged in HubSpot.
Although this lead has had multiple touchpoints with your brand, they still may not know exactly what problems you solve or what value you can deliver.
Let’s say this lead has a great conversation with one of your team members at an in-person event, your team member scans them with Popl, and then books a meeting with that lead. When that happens, if we have a multi-touch attribution model in place, then we can recognize that while this lead was already in our database and had previously had some interactions with our brand, it was clearly the in-person touchpoint that carried the most weight because that interaction was the last activity to occur before the lead converted into a qualified sales opportunity.
In this case, we cannot technically say that this was an “event-sourced lead.” Instead, the correct terminology would be to consider it an “event-influenced lead.” While the lead didn’t first discover your brand at the in-person event, we can attribute the event as the primary reason that the lead converted to an opportunity.
The group of reports listed below represents event-influenced metrics rather than event-sourced metrics. If you’re ready for multi-touch attribution, we suggest adding these reports to your Event ROI Dashboard. But before we add these reports, we’ll first need to set up a few workflows in HubSpot. We’ll cover these in the next section.
Event-influenced attribution reports:
1. Event-influenced leads (by event)
2. Event-influenced pipeline (by event)
3. Event-influenced deals (by event)
4. Event-influenced revenue (by event)
Workflows for Populating Your Multi-Touch Attribution Properties
As mentioned previously, HubSpot’s default properties are a solid starting point for attribution reporting. But to run a more sophisticated, multi-touch attribution system, you will need to create new custom properties and set up workflows in HubSpot to populate them.
You will need to populate the data for these new properties on all of your existing HubSpot contacts before we can add 4 additional “event-influenced” reports to your Event ROI Dashboard.
Here’s How to Create a Workflow in HubSpot:
-
Left-hand sidebar menu → Automation → Workflows → Create workflow
-
Add a Start Trigger
-
Start trigger when “Records meet custom conditions”
-
Assign the custom conditions.
-
Add an Action
-
Select “Edit record” as action type
-
Choose which record you want to edit


How to populate that data:
1. Original GTM Motion
-
HubSpot is famous for coining the term “Inbound Marketing.” Therefore, most of the leads in your HubSpot contacts will come from an “Inbound” source.
-
We suggest creating a workflow that assigns the “Original GTM Motion” property to your existing HubSpot contacts based on the value of their “Original Traffic Source” property.
-
For example, if “Original Traffic Source” = “Organic Search,” the contact’s “Original GTM Motion” should be set to “Inbound.”
2. Latest GTM Motion
-
For your existing HubSpot contacts, the “Latest GTM Motion” will typically be the same as the “Original GTM Motion.”
-
You can use a workflow to check the “Latest Traffic Source,” and use that data point as the logic in your workflow to assign the “Latest GTM Motion.”
3. Original Lead Source
-
This is essentially a customized, more robust version of HubSpot’s default property called the “Original Traffic Source.” That default property lacks many common source options, such as “In-Person Events,” and until recently, it lacked “AI Search.” We suggest using the “Original Lead Source” as a replacement for the default “Original Traffic Source.”
-
You can use a workflow to map the existing value for the “Original Traffic Source” over to the empty value for your new “Original Source Property.”
4. Latest Lead Source
-
Similarly to how you used a workflow to populate the “Original Lead Source,” you can populate the "Latest Lead Source” from HubSpot’s default “Latest Traffic Source” property.
Add Multi-Touch, Event-Influenced Reports to Your Dashboard
Now that we’ve populated the HubSpot data for our new “GTM Motion” and “Lead Source” properties, we’re ready to use them to create reports showing “event-influenced” metrics.
Each of the four advanced reports below is listed in a way that will make it easy for you to understand which properties to apply to both the “Configure” tab and the “Filters” tab of each report. By default, we recommend using “Vertical bar” chart types for all of your reports. You can always change the chart type later to suit your preferences better.
To Create a New Report in Your Event ROI Dashboard:
From your Event ROI Dashboard > Top right corner > Add content > Create report > Select Custom Report > Choose “Contacts” as the Primary data source
Report #1: Event-Influenced Leads (by Event)
Configure Tab:
-
Choose a Vertical bar as the Chart Type
-
X-axis: Datestamp “Latest Popl Lead Captured”
-
Set the Frequency of the axis to “Monthly”
-
Y-axis: (Count) contacts
-
Break down by the “Latest Popl Event Name”
Filter Tab:
-
The “Latest Popl Event Name” is known
-
The “Latest GTM Motion” is “Outbound”
-
The “Latest Lead Source” is “Event”
Report #2: Event-Influenced Deals (by Event)
Configure Tab:
-
Choose a Vertical bar as the Chart Type
-
X-axis: Datestamp, the “Latest Popl Lead Captured”
-
Set the Frequency of the axis to “Monthly”
-
Y-axis: (Count) Contacts
-
Break down by: the “Latest Popl Event Name”
Filter Tab:
-
The “Latest Popl Event Name” is known
-
The “Latest GTM Motion” is “Outbound”
-
The “Latest Lead Source” is “Event”
-
Number of associated deals is greater than or equal to 1
Report #3: Event-Influenced Pipeline (by Event)
Configure Tab:
-
Choose a Vertical bar as the Chart Type
-
X-axis: Recent deal creation date
-
Set the Frequency of the axis to “Monthly”
-
Y-axis: Recent deal amount
-
Break down by: the “Latest Popl Event Name”
Filter Tab:
-
The “Latest Popl Event Name” is known
-
The “Latest GTM Motion” is “Outbound”
-
The “Latest Lead Source” is “Event”
-
Number of associated deals is greater than or equal to 1
Report #4: Event-Influenced Revenue (by Event)
Configure Tab:
-
Choose a Vertical bar as the Chart Type
-
X-axis: Recent deal close date
-
Set the Frequency of the axis to “Monthly”
-
-
Y-axis: Recent deal amount
-
Break down by: the “Latest Popl Event Name”
Filter Tab:
-
The “Latest Popl Event Name” is known
-
The “Latest GTM Motion” is “Outbound”
-
The “Latest Lead Source” is “Event”
-
Number of associated deals is greater than or equal to 1
-
The recent deal close date is known
Why Event Attribution Matters
Event success isn’t about just counting badge scans and adding leads to your CRM.
It’s about connecting leads to revenue, proving ROI, and justifying your marketing budget for in-person events.
With proper attribution, you can see exactly which events, reps, and touchpoints drive impact to your company’s bottom line. Events stop being a “black box” and start becoming a repeatable growth lever.
Proper attribution helps you:
-
Understand which events deliver ROI and where to invest
-
Identify top-performing members of your team
-
Justify expensive event budgets with real data
Congrats! You’re an In-Person GTM Expert Now
You've unlocked the ability to turn in-person events into a measurable growth channel. Feel free to modify the reports in this Event ROI Dashboard as needed to suit your unique business needs.
If you have any questions, please reach out to your dedicated Customer Success Manager, or click here to request one.


![[Featured image / hero]: Abstract graphic of a handshake with negotiation and deal elements (contract, dollar signs, balance scale) in the background. Keep this one as the only abstract graphic to anchor the article.](http://popl.co/cdn/shop/articles/11_Post-event_sales_techniques_to_close_more_deals_42a2a532-7b2d-461b-a6e6-d6519f8cd106.png?v=1779890225&width=600)